This post captures my financial journey thus far. It continues the documentation initiated in 2021 through three earlier articles: Annual Letter 2021, Annual Letter 2022, and Annual Letter 2023.
I hope this article adds value to your life. While my financial numbers and goals may not directly apply to you, please adapt the insights to your reality. Consider factors such as your country, financial position, and personality.
1st of January 2025
Dear Future, Me,
The S&P 500 index, measured in US dollars, saw impressive growth of nearly 24.01 percent. Thankfully, our portfolio matched this performance, achieving a return of 29.43 percent. However, it’s important to note that our performance may appear better than it is because our primary currency is the euro. The portfolio’s value currently stands at €138.9 thousand, an increase of more than €46.0 thousand compared to the previous year. Looking ahead, we expect the portfolio’s future returns to be low due to relatively high valuations.
This letter will cover three main aspects: the asset allocation within the portfolio, the results from the current year, and the outlook for the portfolio moving forward.
Portfolio asset allocation
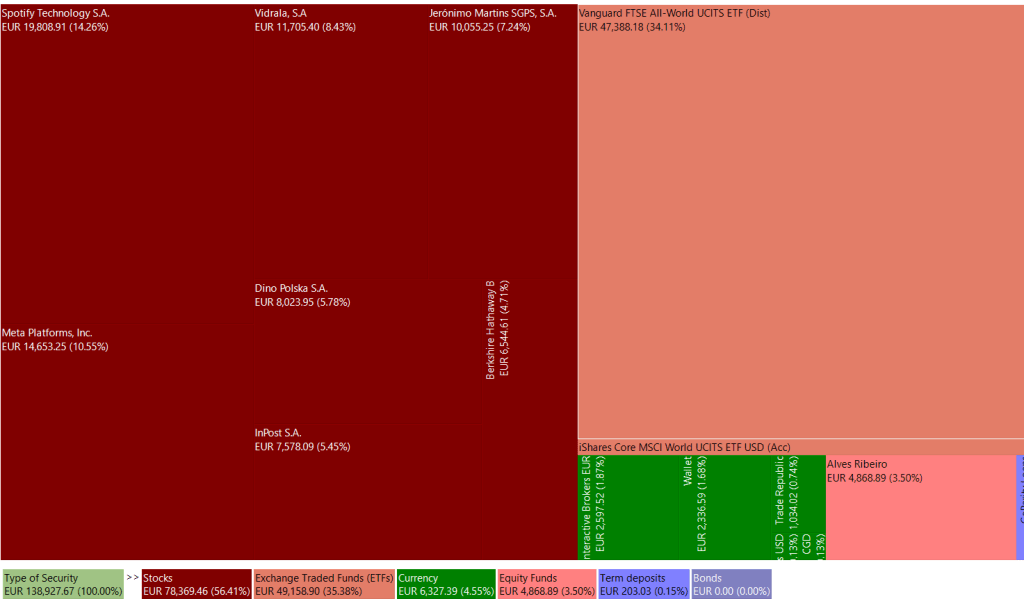
In 2024, we allocated the majority of our investments to individual stocks. As a result, our cash position currently stands at 4.55%. However, we expect this percentage to decrease to around 2.55% as we continue with an ongoing investment that will be finalized in a couple of days. I will provide more details about this investment in a future letter.
Increasing our liquidity will strengthen the portfolio’s resilience in the coming year and ensure we have sufficient resources to capitalize on future opportunities. While our strategy focuses on investments in ETFs, we have discovered more potential in individual stocks. Only time will tell whether this was a good decision.
The table below shows the portfolio allocation by asset.
| Assets | 2024 (%) | 2023 (%) |
| ETFs | 35.38 | 38.86 |
| Individual Stocks | 56.41 | 46.33 |
| Equity and bond funds | 3.50 | 9.97 |
| Cash and equivalents | 4.55 | 4.69 |
| Term deposits | 0.16 | 0.00 |
| Personal bond (NMC bond) | 0 | 0.16 |
Current year’s results
The book value has increased by 44.93 percent, totaling €164.7 thousand. This book value consists of a portfolio of financial assets and a 50 percent ownership share in my flat. I have a debt of €33.0 thousand associated with the purchase of the flat. As previously mentioned, the value of the portfolio is €138.9 thousand, with the remaining amount attributed to the value of the flat.
The table below outlines the composition of book value.
| Metric | Value (€) |
| Total Assets | 197677.64 |
| Total Liabilities | 33002.02 |
| Book Value | 164675.63 |
Since 2018, the book value has been growing at an average rate of 44.93 percent per year. This growth has mainly been driven by salary increases, interest, dividends, and asset appreciation. However, such a high growth rate is not sustainable. To maintain or enhance this growth rate, we need to rethink our strategy.
Next year the expected salary savings are projected to contribute approximately 10 percent to the book value. Meanwhile, interest, dividends, and asset appreciation may experience a decline due to relatively high valuations. Even if they contribute positively, we do not expect this impact to exceed 10 percent.
This leads us to reconsider the following question: What will be the sources of additional income/profit in the coming years?
This question concerns an ongoing issue clouded by two unusual outlier investments: Meta Platforms and Spotify. While I expect both companies to yield positive returns in the future, I do not anticipate them growing at the same rate. I want to express my gratitude to these companies for being the driving forces behind our portfolio growth. However, it is now my responsibility to identify new growth engines.
The table below outlines the composition of portfoleo.
| Number Of Shares/Units | Holding Period (days) (1) | Assets | Cost (€) | Market Value (€) | IRR (%) | Abs.Perf. (%) (2) |
| 545 | 164 | Jeronimo Martins | 8941.27 | 10055.25 | 3.24 | 1.66 |
| 15 | 1425 | Berkshire Hathaway | 3061.93 | 6544.61 | 22.47 | 113.74 |
| 245.8 | 294 | Alves Ribeiro | 4572.00 | 4868.89 | 3.06 | 6.20 |
| 357 | 720 | Vanguard FTSE All-World UCITS ETF (Dist) | 36757.63 | 47388.18 | 14.92 | 27.87 |
| 17 | 1458 | iShares Core MSCI World UCITS ETF USD (Acc) | 1031.58 | 1770.72 | 14.49 | 71.65 |
| 126 | 744 | Vidrala (3) | 9526.90 | 11705.40 | 9.92 | 14.90 |
| 26 | 937 | Meta Platforms, Inc. (4) | 7523.97 | 14653.25 | 58.12 | 101.75 |
| 46 | 807 | Spotify Technology S.A. | 5050.22 | 19808.91 | 85.24 | 292.13 |
| 88 | 287 | Dino Polska S.A. | 7215.08 | 8023.95 | 14.05 | 11.16 |
| 459 | 79 | Inpost S.A. | 7885.54 | 7478.09 | (16.60) | (3.90) |
| 91566.12 | 132297.25 |
- Holding period from the date the first share was bought.
- Absolute Performance = market value + sell/outbound deliveries + dividends – taxes – fees – initial valuation – buy/inbound deliveries. This calculation for absolute performance is limited to 2018 to the present.
- 14 out of 126 Vidrala shares were issued as bonus shares at no cost, but they are accounted for as an expense, negatively impacting performance.
- This year, the sale of Meta shares resulted in realized gains of approximately €2,910.48 which is not contemplated in the table.
The strategy’s core consists of increasing the “look-through” earnings. The earnings sources are salary and investments. The annual letter 2021 contains more details about the “look-through” earnings concept.
The tables below present a draft of my “look-through” earnings. These values are approximations, not precise, and are only used to provide a sense of increase or decrease in the earnings.
| Assets | Number of shares 2024 | EPS 2023 (origin currency) | EPS 2023 (€) (1)(2) | Earnings (€) |
| Spotify Technology S.A. | 46 | -$2.73 | -2.457 | -113.02 |
| Jeronimo Martins | 545 | €1.2 | 1.2 | 654 |
| Meta Platforms, Inc. | 26 | $14.87 | 13.383 | 347.96 |
| Berkshire Hathaway, Inc. | 15 | $10.06 | 9.054 | 135.81 |
| Vidrala S.A. | 126 | €6.89 | €6.89 | 868.14 |
| Dino Polska S.A. | 88 | PLN 14.33 | 3.1526 | 277.43 |
| Vanguard FTSE All-World UCITS ETF (Dist) | 357 | €7.31 | 7.31 | 2609.67 |
| iShares Core MSCI World UCITS ETF USD (Acc) | 17 | €5.30 | 5.30 | 90.10 |
| Inpost S.A. | 459 | PLN 1.3 | 0.286 | 131.27 |
| 5001.36 |
- $1 equals to €0.90.
- 1 PLN equals to €0.22.
| 2024 | 2023 | Delta (%) | |
| Gross Earnings (€) | 5001.36 | 4109.15 | 21.72 |
| Tax (28%) (€) | (1400.38) | (1150.56) | 21.72 |
| Net Earnings (€) | 3600.98 | 2958.59 | 21.72 |
| Net salary savings (€) | 14000 | 14000 | 0 |
| “Look-Through” Earnings (€) | 17600.98 | 16958.59 | 3.79 |
This year, “look-through” earnings grew by 3.79 percent, driven by net earnings of 21.72 percent. However, the growth in earnings has slowed compared to 2023, when the increase was 10.48 percent. The challenge for the next couple of years will be finding ways to significantly increase “look-through” earnings. Potential solutions might include salary increases or identifying new sources of income.
Success or failure will be measured by the ability or inability to significantly increase earnings.
Portfolio outlook
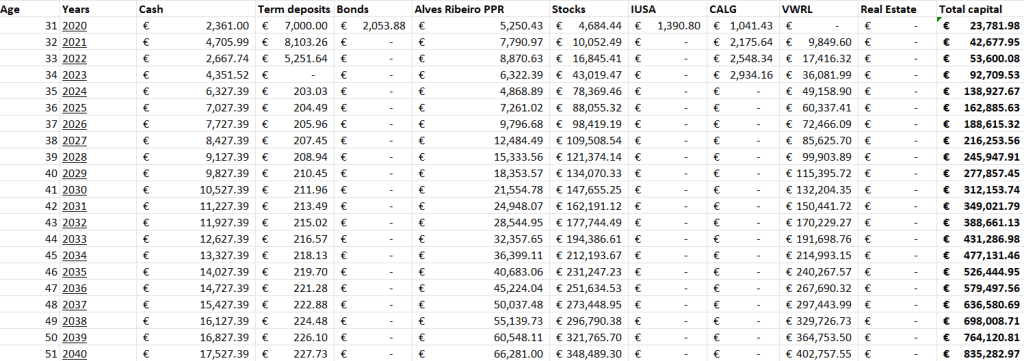
Finally, this section presents a brief outlook on the portfolio’s future. This year’s results keep us on track to reach a portfolio value exceeding 700,000 euros by 2039.
While this goal is achievable, it might be wise to set higher targets. Doing so could increase the likelihood of reaching the initial goal sooner, while also opening up new horizons and opportunities for further achievements.
In the coming years, I am committed to exceeding these goals.

[…] letter to my future self—much like a CEO addressing shareholders. The previous letter was the Annual Letter 2024, and I’ll give you a spoiler: 2024 turned out to be a better year than […]
LikeLike