This post captures my financial journey throughout the year 2023. It continues the documentation initiated in 2021 through two earlier articles titled Annual Letter 2021 and Annual Letter 2022.
I hope this article adds value to your life. While my financial numbers and goals may not directly apply to you, please adapt the insights to your reality. Consider factors such as your country, financial position, and personality.
1st of January 2024
Dear Future, Me,
The year 2023 proved to be highly favorable for all investors. The S&P 500 index, measured in US dollars, experienced an impressive growth of almost 25 percent. Fortunately, our portfolio mirrored this trend and achieved its peak value of 92.8 thousand Euros. Frankly, the portfolio’s return surpassed my expectations, which is undoubtedly positive.
This letter will cover three main aspects: the asset allocation within the portfolio, the results from the current year, and the outlook for the portfolio moving forward.
Portfolio asset allocation
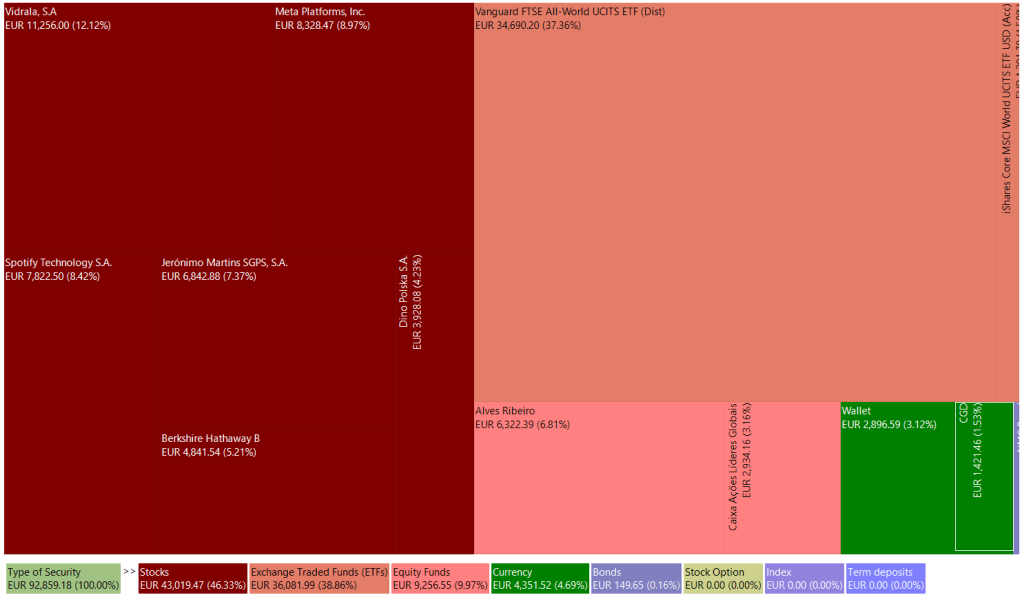
In 2023, a significant portion of our investment portfolio was directed towards individual stocks and ETFs, driven by appealing opportunities. These opportunities are a result of the dip in asset prices the previous year. Nevertheless, due to the investments made in the current year, our cash position suffered a significant decline. In the upcoming year, prioritizing the increase of liquidity will be essential to strengthen the portfolio survival prospects and to have enough firepower to take eventually future opportunities.
The table below illustrates the portfolio allocation by asset.
| Assets | 2023 (%) | 2022 (%) |
| ETFs | 38.86 | 32.49 |
| Individual Stocks | 46.33 | 31.43 |
| Equity and bond funds | 9.97 | 21.30 |
| Cash and equivalents | 4.69 | 13.40 |
| Personal Bond (NMC Bond) | 0.16 | 1.38 |
Current year’s results
An unusual year in the stock market returns support a book value growth of 56.11%. The book value, including real estate equity, reached 116.6 thousand Euros.
The table below presents the portfolio return by asset, excluding real estate. The return of the individual stocks stands out from the others with an impressive 37.31 percent. This performance resulted from some new investments, the outcome of the stock market ‘mini’ crash last year.
Unfortunately, in the long term, the performance of individual stocks will be similar to the ETF Vanguard FTSE All-World. However, these returns boosted the overall portfolio performance to a 26.89% growth in 2023.
| Assets | 2023 (%) | Since 2020 (%/per year) |
| Fund ‘PPR Alves Ribeiro’ | 10.52 | 2.43 |
| Vanguard FTSE All-World UCITS ETF (Dist) | 17.46 | 7.80 |
| iShares Core MSCI World UCITS ETF USD (Acc) | 19.95 | 10.56 |
| Individual stocks | 37.31 | 18.01 |
| Equity fund ‘Ações Líderes globais’ | 15.18 | 8.57 |
The following table shows more details about some assets of the portfolio. The gap between the cost price and the current market value is around 25.55 percent higher, and the average holding period is 1012 days. To simplify the calculation of the holding period, the method was changed. The period starts counting when the first share is bought and ends when the last share is sold.
The gap between cost and market value is expected to grow but not significantly. The main reason for this show growth is that the increase in the company’s earnings will be slow, and we will continue to invest in the next couple of years, increasing the price cost.
Finally, the two outlier investments this year were Meta Platforms S.A and Spotify-Technology S.A, with an absolute return of more than 50%.
| Number Of Shares/Units | Holding Period (days) (1) | Assets | Cost (€) | Market Value (€) |
| 297 | 1880 | Jeronimo Martins | 5811.24 | 6854.76 |
| 15 | 1336 | Berkshire Hathaway | 3061.93 | 4850.81 |
| 342 | 1385 | Alves Ribeiro | 6104.11 | 8870.63 |
| 218.6 | 1244 | Ações lideres globais | 2375 | 2936.99 |
| 313 | 1098 | Vanguard FTSE All-World UCITS ETF (Dist) | 31667.38 | 33647.50 |
| 17 | 1091 | iShares Core MSCI World UCITS ETF USD (Acc) | 1031.58 | 1391.79 |
| 120 | 746 | Vidrala | 8961.10 | 11460 |
| 26 | 683 | Meta Platforms, Inc. | 4643.78 | 8335.43 |
| 46 | 564 | Spotify Technology S.A. | 5050.22 | 7911.77 |
| 37 | 93 | Dino Polska S.A. | 3085.13 | 3894.29 |
| 71791.47 | 90153.97 |
- Holding period since the data that the first share was bought.
The strategy’s core consists of increasing the “look-through” earnings. The earnings sources are salary and investments. This year the contribution from salary stayed flat, but lucky the earnings from investment increased almost 100 percent.
To summarize, the “look-through” earnings increased 10.27 percent from 15.4 to 16.9 thousand Euros, and almost 25 percent of them came from investments.
The tables below present a draft of my “look-through” earnings. The annual letter 2021 contains more details about the “look-through” earnings concept.
| Assets | Number of shares 2023 | Earnings per share 2022 (€) (1) | Earnings (€) |
| Spotify Technology S.A. | 46 | -2.23 | -102.58 |
| Jeronimo Martins | 297 | 0.94 | 208.12 |
| Meta Platforms, Inc. | 26 | 8.59 | 223.34 |
| Berkshire Hathaway | 15 | 20.94 | 314.1 |
| Vidrala | 120 | 4.73 | 567.6 |
| Ações lideres globais | 218.6 | 0.79 | 172.70 |
| Dino Polska S.A. | 37 | 11.55 | 427.35 |
| Vanguard FTSE All-World UCITS ETF (Dist) | 323 | 6.84 | 2209.32 |
| iShares Core MSCI World UCITS ETF USD (Acc) | 17 | 4.95 | 89.20 |
| 4109.15 |
- After fees and taxes.
| 2023 | 2022 | Delta (%) | |
| Gross Earnings (€) | 4109.15 | 2054.86 | 99.97 |
| Tax (28%) (€) | (1150.56) | (575.36) | 99.97 |
| Net Earnings (€) | 2958.59 | 1379.5 | 114.47 |
| Net salary savings (€) | 14000 | 14000 | 0 |
| “Look-Through” Earnings (€) | 16958.59 | 15379.5 | 10.27 |
Portfolio outlook
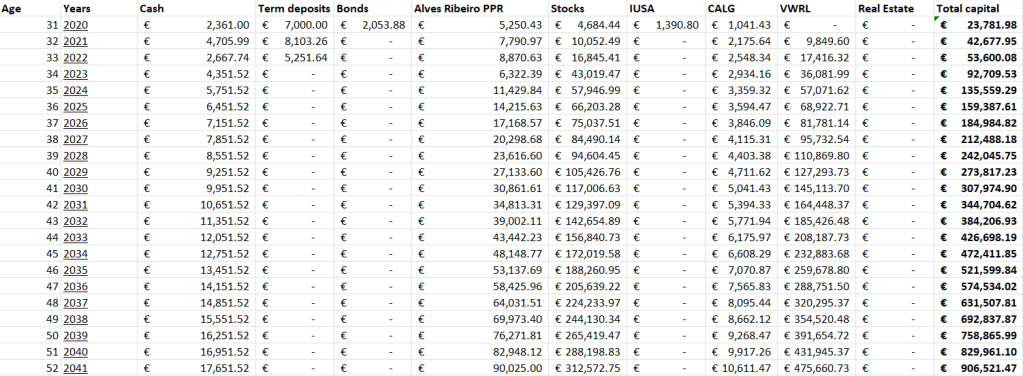
Finally, this last section presents a brief expectation about the portfolio’s future. The current year’s result allows us to anticipate portfolio results in two years. Now, it’s expected that the portfolio reach the value of 700 thousand Euros in 2039 instead of 2041.
In the coming years, I am committed to exceeding these goals.

Thanks for the Read !!!!
take care
LikeLiked by 1 person
[…] This post captures my financial journey thus far. It continues the documentation initiated in 2021 through three earlier articles: Annual Letter 2021, Annual Letter 2022, and Annual Letter 2023. […]
LikeLike