The post Annual Letter 2021 documented my financial journey through the year 2021. In this new post, I did the same exercise for the year 2022. I hope this article adds value to your life.
My financial numbers and goals may not directly apply to you. Please, adapt the insights to your reality, considering factors like your country, financial position, and personality.
1st of January 2023
Dear Future Me,
I hope this letter finds you well! It marks the second year of our annual new tradition—documenting our journey through the stock market. Buckle up; there’s much to share!
Portfolio asset allocation
Let’s start with an image of our current portfolio valued at 53.6 thousand euros. It comprises approximately 13.40% in cash, 21.30% invested in bonds and equity funds (Ações lideres globais and PPR Alves Ribeiro), 32.49% invested in the ETF Vanguard FTSE ALL-World, and approximately 31.43% invested in individual stocks.
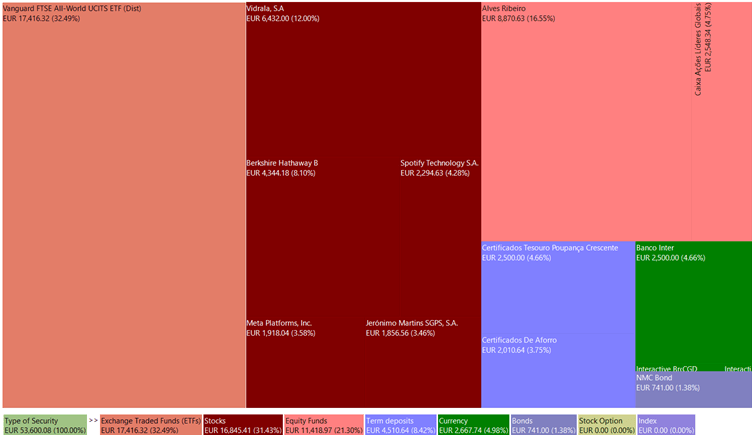
Now, 2022 has been a rollercoaster. The drop in stock prices has opened the door to some new opportunities.
A significant part of the available cash was invested in the ETF Vanguard FTSE ALL-World and individual stocks. Check out the table below for a quick summary of the changes:
| Asset type | 2022 (%) | 2021 (%) |
| ETF Vanguard FTSE ALL-World | 32.49 | 23.08 |
| Individual stock | 31.43 | 23.55 |
| Equity and bond funds | 21.30 | 23.35 |
| Cash and equivalents | 13.40 | 30.02 |
| Personal Bond (NMC Bond) | 1.38 | – |
In short, our holdings in the ETF and individual stocks have increased significantly. Cash has decreased, and we have welcomed a new security – NMC Bond.
NMC Bond is not an investment; it’s a loan to pay for next year’s wedding party. The loan cost will be 0% interest plus the opportunity cost. The long-term goal is to repay the loan, but in the medium term, the loan will represent at least 1.5% of the portfolio value. By the end of 2023, it will be at least 8% (€4000).
The table below summarizes the expected wedding party costs.
| Expected costs (€) | 7500–9000 |
| Expected revenue (€) | 4000 |
| Expected profit/loss (€) | (-3500)-(-4000) |
Long-term portfolio structure
Now, this section presents the long-term portfolio structure goal. The structure is designed for a secure, stable, and reliable income source with minimal effort. About 50% goes to the ETF, 35% to individual stocks, and the rest dabbles in cash and other investments.
| Assets | Percentage minimum and maximum (%) |
| ETF Vanguard FTSE ALL-World | 50 -85 |
| Individual Stock | 0-35 |
| Others | 0-10 |
| Cash | 0-5 |
For next year, the minimum amount saved will be fourteen thousand euros (14k). 10% will remain in cash, 14% will be invested in a tax-advantaged fund (PPR Alves Ribeiro), and the remainder will be invested in the ETF. Investing in individual stocks is optional but can also happen.
Current year’s results
The book value (stock portfolio + real estate) increased by 19.48%, reaching €74,718.88. It’s a little shy compared to 2021’s 49% growth. The decrease in growth is due to the fall in share prices and the size of assets under management. The main contribution to the growth in book value was savings, and a debt reduction (real estate loan).
The table below gives you a peek into the performance, the calculation of values may contain gross errors:
| Assets | 2022 (%) | Since 2020 (%/per year) |
| Fund ‘PPR Alves Ribeiro’ | -11.10 | 3.47 |
| ETF FTSE ALL-World | -13.61 | 7.82 |
| Individual Stocks | -2.05 | 11.57 |
| Equity fund ‘Ações Líderes globais’ | -14.63 | 9.7 |
In the future, the fund ‘Ações Lideres Globais’ will not receive more capital contributions. To simplify the investment process and to reduce the fees paid the capital will be deployed in ETF FTSE ALL-World.
Now, let’s crunch some portfolio numbers. The average security holding period is 547 days, more 122 days than last year, the current price is ~1.9% lower than the purchase price, and the portfolio age is three years old, excluding Jeronimo Martins‘s investment. The gap between purchase and current prices will improve if the companies can generate profits and reinvest part of it successfully.
The table below summarizes portfolio numbers.
| Number Of Shares/Units | Holding Period (days) | Company | Cost (€) | Market Value (€) |
| 92 | 1515 | Jeronimo Martins | 997.7 | 1856.56 |
| 15 | 693 | Berkshire Hathaway | 3061.93 | 4344.18 |
| 533.6 | 668 | PPR Alves Ribeiro | 8985 | 8870.63 |
| 218.6 | 600 | Ações lideres globais | 2375 | 2548.34 |
| 188 | 518 | FTSE ALL-World ETF | 19090.34 | 17416.32 |
| 80 | 274 | Vidrala | 5638.60 | 6432.00 |
| 5 | 205 | Meta Platforms, Inc. | 2339.39 | 1353.91 |
| 12 | 292 | Meta Platforms, Inc. | 913.55 | 564.13 |
| 31 | 161 | Spotify Technology S.A. | 3178.27 | 2294.63 |
| 46579.78 | 45680.7 |
The core of the strategy is to increase the “look-through” earnings.
The “look-through” earnings represent the income that I can generate and save each year. Currently, most of its earnings come from my salary (~91%). The remaining income is generated from the companies that I invested in.
The following table shows a draft of my “look-through” earnings.
| Assets | Number of shares in 2022 | Earnings per share 2021 (€) (1) | Total 2021 (€) | Total 2020(€) | Variations (%) |
| Spotify Technology S.A. | 31 | -0.18 | -5.58 | – | – |
| Jeronimo Martins | 92 | 0.74 | 68.08 | – | – |
| Meta Platforms, Inc. | 17 | 13.8 | 234.6 | – | – |
| Berkshire Hathaway | 15 | 5.54 | 83.1 | – | – |
| Vidrala | 80 | 4.65 | 372 | – | – |
| Ações lideres globais | 218.6 | 0.67 | 146.462 | – | – |
| FTSE ALL-World ETF | 188 | 6.15 | 1156.2 | – | – |
| 2054.86 | 1055.88 | 94.61 | |||
| Tax (28%) | (575.36) | (295) | 95.00 | ||
| Net EPS | 1379.5 | 760.88 | 81.30 | ||
| Net salary savings | 14000 | 13160 | 6.38 | ||
| “Look-Through” Earnings | 15379.5 | 13920.88 | 10.48 |
- After fees and taxes.
This year, they increased by 10.48%, thanks to salary increases (6% increase) and soaring net earnings per share (81% increase).
Portfolio outlook
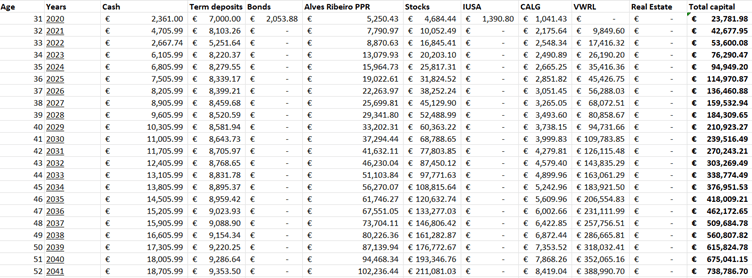
Let’s look at the portfolio’s outlook. Even with a slight deviation from the plan, it is expected to reach the value of 738 thousand euros in 2041. In the coming years, I am committed to exceeding these goals.

[…] This post captures my financial journey throughout the year 2023. It continues the documentation initiated in 2020 through two earlier articles titled Annual Letter 2021 and Annual Letter 2022. […]
LikeLike
[…] continues the documentation initiated in 2021 through three earlier articles: Annual Letter 2021, Annual Letter 2022, and Annual Letter […]
LikeLike