Since 2021, I’ve been documenting my financial journey through annual letters. Each year, I review my accomplishments and plans. Writing to myself enables reflection and the documentation of my financial journey.
Please note that my financial numbers and goals may not directly apply to you. You’ll need to adapt the insights to your reality, considering factors like your country, financial position, and personality.
I encourage you to embark on your financial reflection journey. It’s a rewarding practice that can offer valuable insights into your financial decisions. Whether you find practical takeaways or simply enjoy a moment of relaxation, I hope this article adds value to your life.
1st of January 2022
Dear Future Me,
This letter inaugurates an annual series documenting my journey through the stock market. Each entry encapsulates my thoughts, expectations, strategies, and results. The four integral sections cover portfolio asset allocation, the expected return of the portfolio, the results for 2021, and the portfolio outlook.
Portfolio Asset Allocation
As of December 31, 2021, my portfolio comprises approximately 30% cash and term deposits, 23% in bonds and equity funds, 23% in a Global ETF (FTSE ALL-World), and another 23% in stocks selected for me.
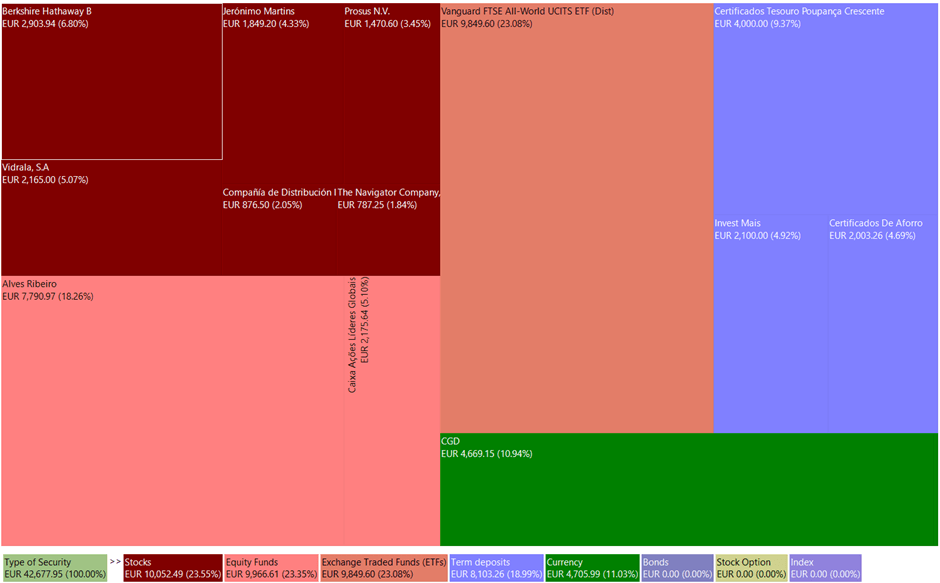
Cash and Term Deposits: The portfolio maintains a high level of cash and equivalents, not as an attempt to predict a market crash but to ensure sufficient liquidity to face any unforeseen challenges. Over time, the cash percentage will decrease but always remain at least equal to one year of my expenses.
Bonds and Equity Funds: A significant portion (80%) of the capital invested in global equity and bond funds is allocated to a fund named ‘PPR Alves Ribeiro.’ This investment aims to secure tax benefits, resulting in an annual reduction equal to 20% of the allocated capital, up to a maximum of €400. While some argue that this money might have compounded at a higher rate in a global equity index, the certainty of this tax break is a key consideration. It is anticipated that the weight of this investment in the portfolio will diminish as the portfolio value increases and the tax reduction decreases with age. The remaining capital is invested in an equity fund named ‘Ações Líderes Globais,’ primarily focused on the quality factor and expected to perform at the level of a global equity index.
Global ETF (FTSE ALL-World): A significant portion of the portfolio is allocated to the FTSE ALL-World ETF, representing almost 95% of public companies worldwide. This fund’s performance reflects the anticipated average return of the global stock market, with expectations for most of the portfolio’s capital to be invested here in the long term.
Equity Investments: Finally, there are a couple of individually selected securities that outperform the expected average return of the global stock market, benchmarked against the FTSE ALL-World index. My approach is to acquire a business, preferably a great one, at prices that allow a net compounding rate exceeding at least 3% of the expected average net return of the global stock market for no less than ten years.
The Expected Return of the Portfolio
The portfolio’s expected return is 5.77% pa (gross value) and 4.05% pa (net value). The estimation approach varies by asset group. For global equity ETFs and equity funds, the expected return is based on the historical performance of the fund’s benchmarks. As no benchmark was found for ‘PPR Alves Ribeiro,’ belonging to the bond and equity fund group, the average returns over the last five years were utilized. The expected return for individually selected stocks was calculated at the time of purchase, bearing in mind its susceptibility to analysis errors. I intend to enhance net expected returns by reducing the percentage of cash in the portfolio and minimizing failures in stock selection.
| Assets | Asset Group | Gross return (E) % | Net return (E) % | Notes |
| Fund ‘PPR Alves Ribeiro’ | Bond/Equity funds | 5.67 | 5.22 | Average of the last 5 years’ performance |
| FTSE ALL-World ETF | Global equity ETFs | 6.57 | 4.73 | Average MSCI ACWI Index performance (since 1972) |
| Equity fund ‘Ações Líderes Globais’ | Equity funds | 6.57 | 4.73 | Average MSCI ACWI Index performance (since 1972) |
| Stocks | Stock pick | – | 10 | Portfolio stocks expected return analysis |
Results
In 2021, my book value increased by approximately 49% from €41,826.97 to €62,584.36. The main drivers for this growth were the increase in my salary, allowing for an improvement in my savings ratio, a reduction in indebtedness (home loan), and the appreciation of the portfolio. This section focuses on portfolio appreciation. The portfolio appreciation, including cash and equivalents, was 12.74%. This unexpected appreciation was driven by the growth of the stock market.
| Assets | Performance (%) |
| Fund ‘PPR Alves Ribeiro’ | 6.22 |
| ETF FTSE ALL-World | 27.00 |
| Equity Investments (Stock Picking) | 29.85 |
| Equity fund ‘Ações Líderes Globais’ | 30.69 |
The following table contains the purchase prices and current prices of the current portfolio holdings (stocks and funds). The assets’ current prices are approximately 20% higher than the initial prices. However, this variation is not very relevant due to the recent establishment of the portfolio. The average portfolio asset holding period is 425 days, to achieve an average holding period of at least 10 years. I anticipate that the gap between purchase and current prices will increase in the long run, contingent upon companies continuing to generate profits and successfully reinvesting in the business.
| Number Of Shares/Units | Holding Period (days) | Company | Cost (€) | Market Value (€) |
| 92 | 1151 | Jeronimo Martins | 997.7 | 1849.20 |
| 11 | 558 | Berkshire Hathaway | 1884.94 | 2903.94 |
| 377.9 | 447 | Alves Ribeiro | 6840 | 7790.97 |
| 235 | 449 | The Navigator Company | 505.2 | 787.25 |
| 50 | 436 | Logista | 713 | 876.50 |
| 141 | 381 | Ações Líderes Globais | 1598 | 2175.64 |
| 72 | 209 | FTSE ALL-World ETF | 8813.96 | 9849.60 |
| 20 | 173 | Prosus | 1552.7 | 1470.60 |
| 25 | 17 | Vidrala | 2017 | 2165 |
| 24922.5 | 29868.7 |
The subsequent table displays a draft of my “look-through” earnings, the core concept of my strategy. To diversify my income sources, I will utilize all excess capital from my salary to buy stakes in public companies, directly or through funds. The “look-through” earnings represent the income I can generate and save each year, with the majority currently coming from my net salary (approximately 90%). The remaining income is generated from the companies I have stakes in, with the unique aspect of being deployed by the companies’ managers or returned to me through dividends or buybacks. To estimate net “look-through” earnings, the companies’ earnings per share are aggregated, and a tax is applied as if they were distributed as dividends. The primary long-term goal of “look-through” earnings is to increase them and reduce the weight of the salary, despite the expected increase in salary in the future.
| Investees | Number of shares in 2021 | Earnings per share 2020 (€) (1) |
| Logista | 50 | 66 (2) |
| Jeronimo Martins | 92 | 46 |
| The Navigator Company | 235 | 35.25 |
| Berkshire Hathaway | 11 | 11.88 |
| Prosus | 20 | 76 (2) |
| Vidrala | 25 | 133.75 |
| Ações Líderes Globais | 159 | 116 |
| FTSE ALL-World ETF | 90 | 571 |
| 1055.88 | ||
| Tax (28%) | (295) | |
| Net EPS | 760.88 | |
| Net salary savings | 13160 | |
| “Look-Through” Earnings | 13920.88 |
- After fees and taxes.
- Earnings per share of 2021.
Outlook
In this final section, a brief expectation about the future of the portfolio is presented. As mentioned earlier, the portfolio has reached a value of approximately €42,000. Assuming the materialization of the expected return presented before for the portfolio value, it will reach the value of €705,000 in 2041.
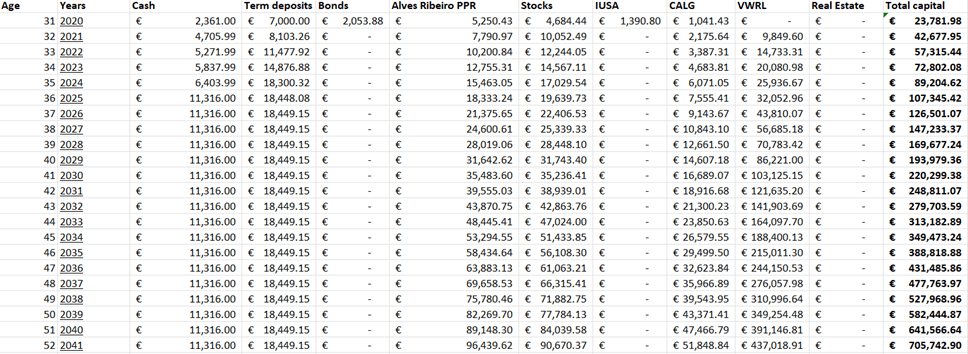
In the upcoming years, I am committed to surpassing these goals.

[…] post Annual Letter 2021 documented my financial journey through the year 2021. In this new post, I did the same exercise […]
LikeLike
[…] the year 2023. It continues the documentation initiated in 2020 through two earlier articles titled Annual Letter 2021 and Annual Letter […]
LikeLike
[…] journey thus far. It continues the documentation initiated in 2021 through three earlier articles: Annual Letter 2021, Annual Letter 2022, and Annual Letter […]
LikeLike
[…] earnings. These earnings are derived from two main sources: salary and investments. The annual letter 2021 provides further detail on the concept and rationale behind “look-through” […]
LikeLike