Annual Letter 2025

This post provides a snapshot of my financial position as of 2025. I began documenting my financial journey in 2021, and every year since, I’ve written an annual letter to my future self—much like a CEO addressing shareholders. The previous letter was the Annual Letter 2024, and I’ll give you a spoiler: 2024 turned out to be a better year than 2025.

I hope this article adds value to your life, just as it does to my future self. My financial numbers and goals are personal and may not directly apply to you, but the underlying ideas are meant to be adapted. Please consider your own context—your country, financial position, and personality—when applying these insights.


1st of January 2026

Dear Future, Me,

This year, our portfolio, measured in euros, returned a modest 3.74%. The result appears weaker when compared with the S&P 500, which, measured in U.S. dollars, rose by nearly 16.65%. There are several reasons for this underperformance—including the fact that it is entirely normal and acceptable—which I will address later.

The portfolio’s current value stands at €163.4 thousand, representing an increase of more than €24.0 thousand, or over 15%, compared with the previous year.

Looking ahead, we expect future returns to improve; however, this may not materialise given today’s relatively high market valuations.

Portfolio asset allocation

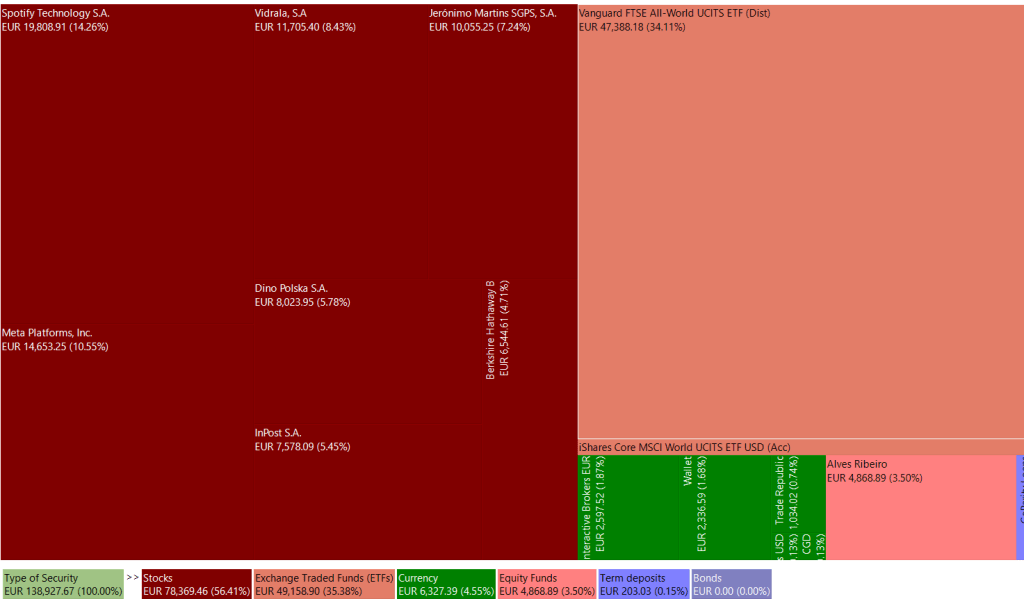
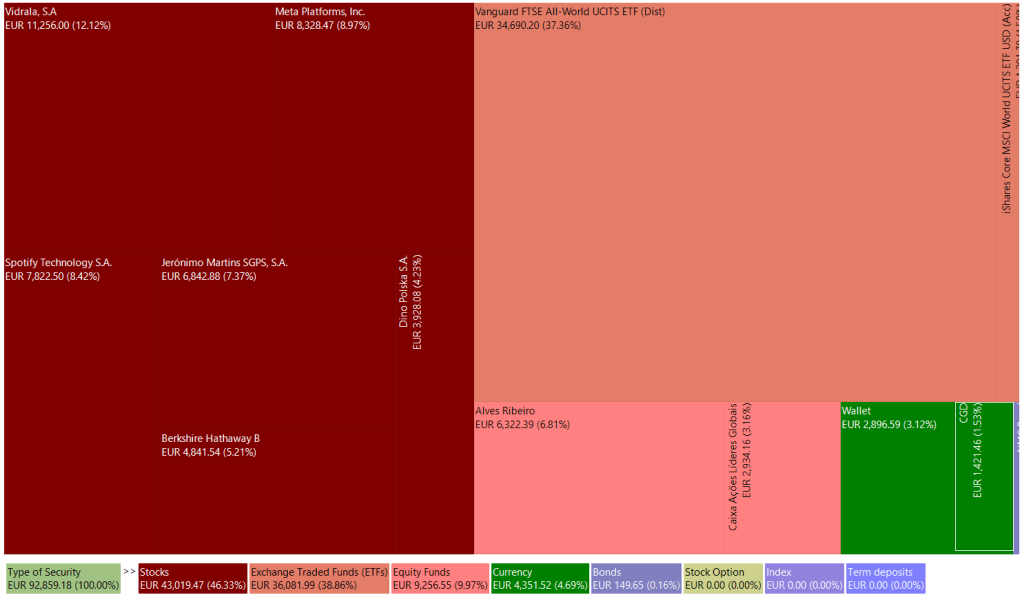
The majority of our investments remain allocated to individual stocks, an approach that has delivered good results over the past years. This year, however, returns were positive but broadly flat, and this trend may persist in the medium term. The reasons are straightforward: mistakes happen, and investing in stocks relies on acquiring businesses at prices below their real value, and such opportunities arise infrequently. When they do, we are confident that we will be ready to act.

Over the past year, our cash position increased to approximately 12% of the portfolio. This level provides resilience and flexibility, allowing us to respond effectively to future opportunities. The remainder of the portfolio is invested in ETFs.

The table below presents the portfolio allocation by asset class.

Assets2025 (%)2024 (%)
Individual Stocks48.0556.41
ETFs34.6935.38
Cash and equivalents12.814.55
Equity and bond funds4.323.50
Term deposits0.130.16

Current year’s results

Our previous reports have shown a portfolio growth of around 3.74%, measured in IRR. The top asset performance in 2025 continues to come from investments in ETFs and individual stocks. The return from the second group decreased significantly. The reasons behind this lower return are quite simple:

  1. On average, only a small subset of stocks delivers superior returns; statistically, the odds are against us.
  2. There are periods of underperformance, even for stocks that outperform over the long term.
  3. Mistakes matter—and yes, this year I made several, including an investment in InPost that directly cost us around 2.5%, excluding opportunity costs.
  4. I will always choose capital protection over outperformance.

To conclude, I do not know whether this underperformance is temporary or permanent, but I do believe there is a reasonable chance of achieving a good result in the long term.

The next table presents the portfolio’s top-performing assets.

Assets2025 (%)2024 (%)
ETFs8.1125.55
Individual Stocks1.5139.53

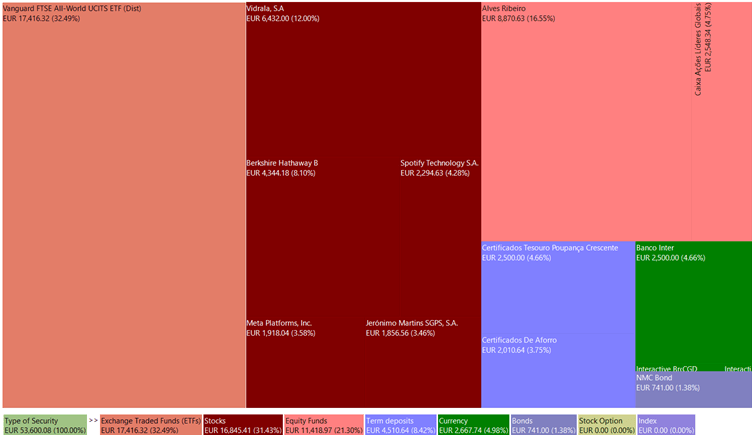
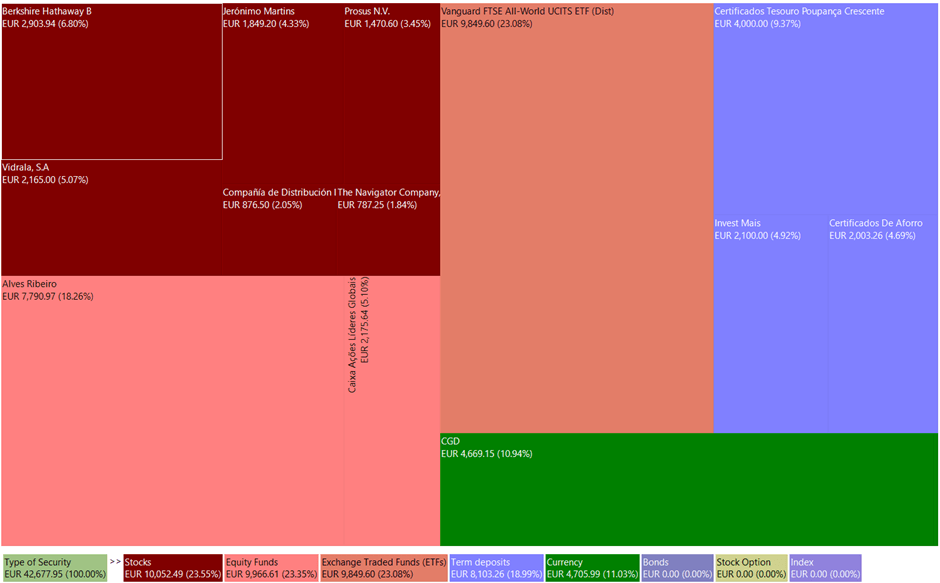
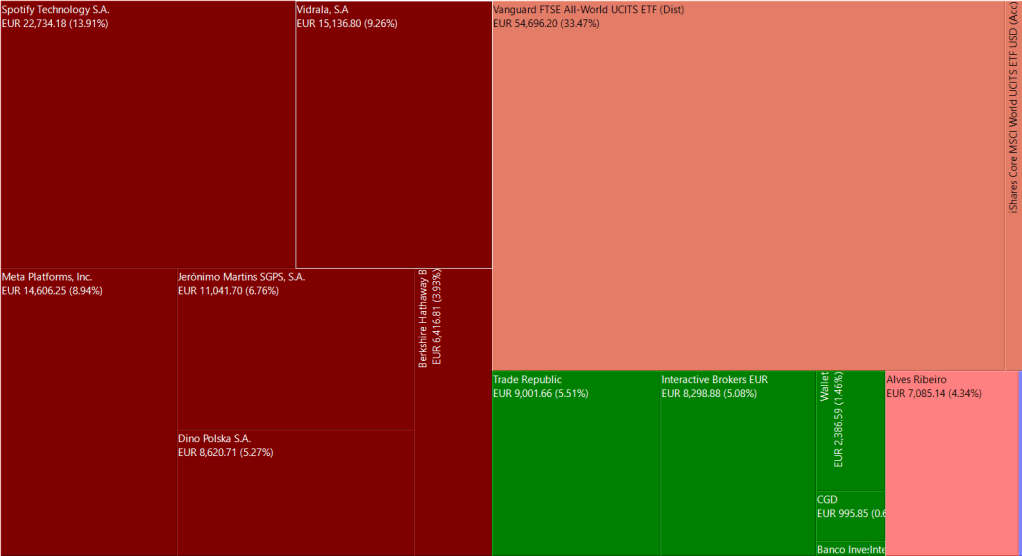
The table below outlines the composition of the portfolio, excluding cash and term deposits.

Number Of Shares/UnitsAssetsTypeCost (€)Market Value (€)IRR (%)Abs.Perf. (%) (1)
545Jeronimo MartinsIndividual Stock8941.2711041.706.678.32
15Berkshire HathawayIndividual Stock3061.936416.8116.97109.57
342.6Alves RibeiroPPR6572.007085.143.236.81
386Vanguard FTSE All-World UCITS ETF (Dist)ETF40485.8754696.2012.9034.16
17iShares Core MSCI World UCITS ETF USD (Acc)ETF1031.581896.0112.9783.80
168VidralaIndividual Stock11452.5415136.8011.7423.56
26Meta Platforms, Inc.Individual Stock7523.9714606.2538.97101.68
46Spotify Technology S.A.Individual Stock5050.2222734.1859.83350.05
880Dino Polska S.A.Individual Stock7215.088620.7110.3519.43
  91334.46142233.8
  1. Absolute Performance = market value + sell/outbound deliveries + dividends – taxes – fees – initial valuation – buy/inbound deliveries. This calculation for absolute performance is limited to 2018 to the present.

The book value grew 13.80% in the last year, totaling €191 thousand.

Metric2025 (€)2024 (€)
Book value191,035.05164.675.63

Our book value has grown through three primary sources: savings from salary, portfolio returns, and the gradual increase in our equity in our flat through mortgage repayments. Historically, these sources have driven an average annual book value growth of 41.31%, although this year recorded the lowest growth rate to date. To sustain—or accelerate—this growth, we need to reinvent some of our existing sources and introduce new ones.

My near-term goal is to develop new sources of growth while rethinking the current ones. In 2025, we experimented with new initiatives such as freelancing and software development for a quarry. While the results have not yet fully materialised, they are expected to do so over time. As an early indication, approximately €1,000 of our book value growth this year can already be attributed to these efforts.

The following table presents the growth rate per year and calculates the average across all years combined.

Year %
2018 41.10
201972.06
202035.09
202149.47
202219.48
202356.11
202441.18
202516.01
41.31

This year, to facilitate the true understanding of our financial health, I drafted our balance sheet. Please check the table below it.

Line Item
ASSETS 
Non-current assets 
Investment in a jointly controlled asset (Flat – 50% ownership)
(recorded at purchase price in 2018)
58,750.00
Right-of-use assets (IFRS 16)0.00
Property, plant and equipment (IAS 16)0.00
Financial assets – non-current0.00
Other non-current assets0.00
Total non-current assets58,750.00
  
Current assets 
Cash and cash equivalents 
• Cash – savings account20,984.76
• Term deposit (≤3 months, penalty-free)213.03
Total cash and cash equivalents21,197.79
Financial assets at FVTPL (Stocks + ETFs)135,148.66
Financial assets at amortised cost (PPR)7,085.14
Other current assets0.00
Total current assets163,431.59
  
TOTAL ASSETS222,181.59
  
EQUITY AND LIABILITIES 
Equity 
Personal capital (Net worth)191,035.05
Total equity191,035.05
  
Non-current liabilities 
Borrowings – real estate loan28,230.54
Lease liabilities – non-current0.00
Other non-current liabilities0.00
Total non-current liabilities28,230.54
  
Current liabilities 
Lease liabilities – current0.00
Borrowings – current portion2,916.00
Other current liabilities0.00
Total current liabilities2,916.00
  
TOTAL LIABILITIES31,146.54
TOTAL EQUITY AND LIABILITIES222,181.59

Every decision I make always focuses on following our long-term core strategy, which is centered on increasing “look-through” earnings. These earnings are derived from two main sources: salary and investments. The annual letter 2021 provides further detail on the concept and rationale behind “look-through” earnings.

As we enter the next phase of our journey, we have slightly adjusted the “look-through” earnings methodology. In addition to the traditional sources, we now include a new earnings stream from projects. This source, which is reported above, contributed approximately €1,000 during the year.

The tables below present a draft version of my “look-through” earnings. The figures are approximate rather than precise and are intended solely to illustrate the direction and magnitude of changes in earnings. Some items (for example, Net Savings) may differ from those shown in the 2024 table.

AssetsNumber of shares 2024EPS 2024
(origin currency)
EPS 2024 (€) (1)(2)Earnings (€)
Spotify Technology S.A.46€5.55.5253
Jeronimo Martins545€0.950.95517.75
Meta Platforms, Inc.26$23.8620.29527.54
Berkshire Hathaway, Inc.15$22.0018.72280.80
Vidrala S.A.168€8.429€8.4291416.07
Dino Polska S.A.880PLN 1.5350.3638320.14
Vanguard FTSE All-World UCITS ETF (Dist)386€6.246.242408.64
iShares Core MSCI World UCITS ETF USD (Acc)17€4.254.2572.25
   5796.2
  1. $1 equals to €0.851.
  2. 1 PLN equals to €0.237.
 20252024Delta (%)
Gross Earnings (€)5796.25001.3613.71
Tax (28%) (€)(1622.94)(1400.38)13.71
Net Investment Earnings (€)4173.263600.9813.71
Net Savings (€)19005.6216446.30 (1)13.47
“Look-Through” Earnings (€)23178.8820047.28 (1)13.51
  1. The values differ from those reported in the 2024 annual report, as some figures were incorrectly reported at that time and have since been corrected.

This year, “look-through” earnings increased by 13.51%. All earnings sources—investment returns and savings from salary and projects—contributed in a balanced manner.

Maintaining this rate of growth becomes more challenging each year, primarily because salary, the largest contributor, has been growing at a slower pace. Potential solutions include salary increases or the identification of new income sources.

Ultimately, success or failure will be measured by the ability—or inability—to materially increase earnings sources over time.
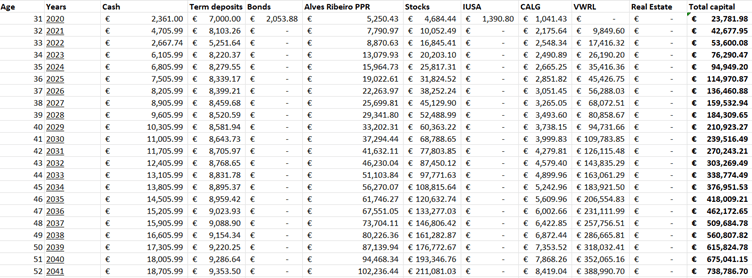
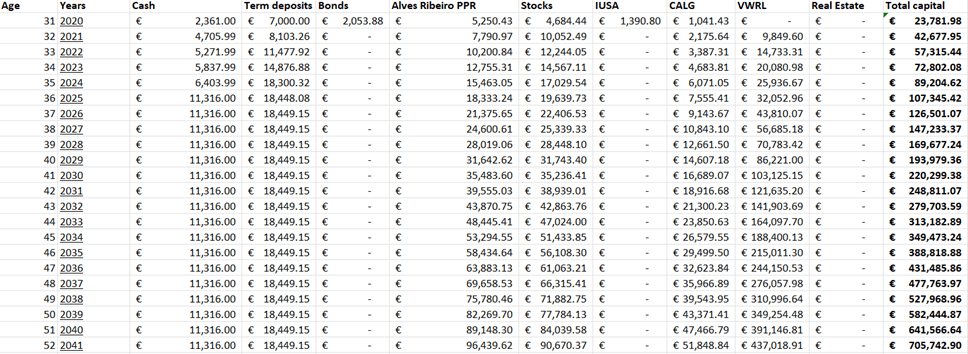
Portfolio outlook

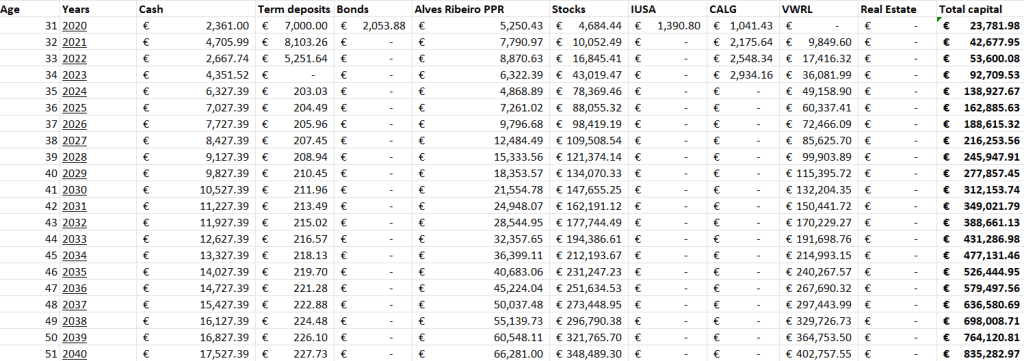
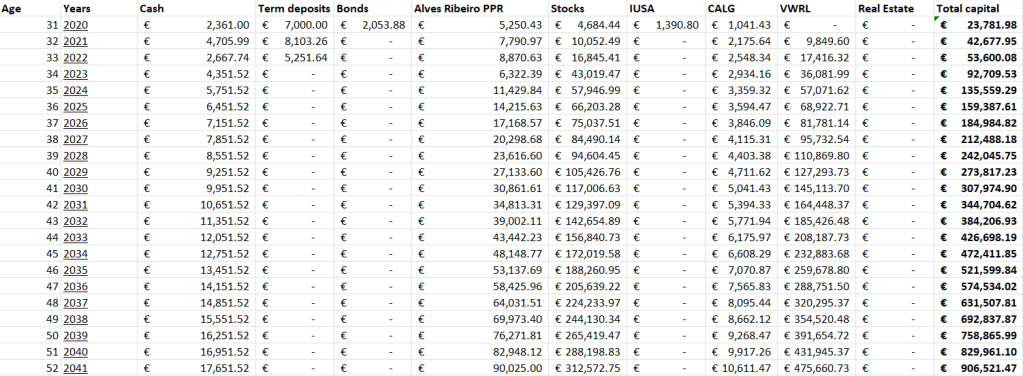
Finally, this section provides a brief outlook on the portfolio’s future. Based on this year’s results, we remain on track to reach a portfolio value in excess of €700,000 by 2039.

While this goal is achievable, it may reflect a degree of limited ambition. It may therefore be prudent to set—and actively pursue—more demanding targets. Why not make 2026 the year to aim higher?

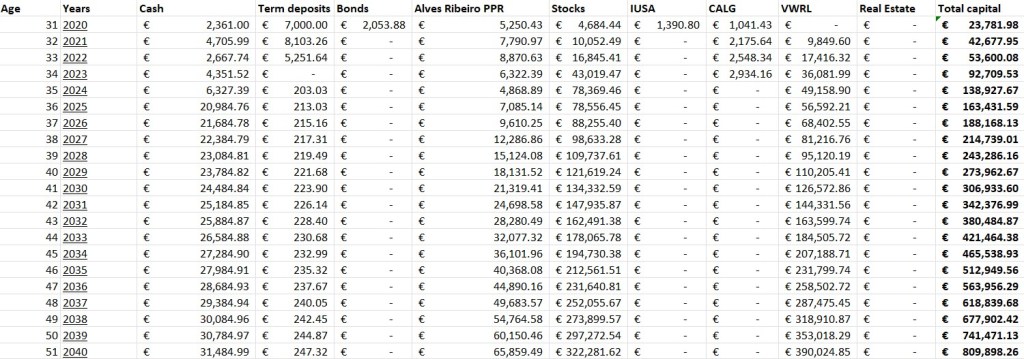
In the coming years, I remain committed to exceeding these goals.

Annual Letter 2024

This post captures my financial journey thus far. It continues the documentation initiated in 2021 through three earlier articles: Annual Letter 2021, Annual Letter 2022, and Annual Letter 2023.

I hope this article adds value to your life. While my financial numbers and goals may not directly apply to you, please adapt the insights to your reality. Consider factors such as your country, financial position, and personality.


1st of January 2025

Dear Future, Me,

The S&P 500 index, measured in US dollars, saw impressive growth of nearly 24.01 percent. Thankfully, our portfolio matched this performance, achieving a return of 29.43 percent. However, it’s important to note that our performance may appear better than it is because our primary currency is the euro. The portfolio’s value currently stands at €138.9 thousand, an increase of more than €46.0 thousand compared to the previous year. Looking ahead, we expect the portfolio’s future returns to be low due to relatively high valuations.

This letter will cover three main aspects: the asset allocation within the portfolio, the results from the current year, and the outlook for the portfolio moving forward.

Portfolio asset allocation

In 2024, we allocated the majority of our investments to individual stocks. As a result, our cash position currently stands at 4.55%. However, we expect this percentage to decrease to around 2.55% as we continue with an ongoing investment that will be finalized in a couple of days. I will provide more details about this investment in a future letter.

Increasing our liquidity will strengthen the portfolio’s resilience in the coming year and ensure we have sufficient resources to capitalize on future opportunities. While our strategy focuses on investments in ETFs, we have discovered more potential in individual stocks. Only time will tell whether this was a good decision.

The table below shows the portfolio allocation by asset.

Assets2024 (%)2023 (%)
ETFs35.3838.86
Individual Stocks56.4146.33
Equity and bond funds3.509.97
Cash and equivalents4.554.69
Term deposits0.160.00
Personal bond (NMC bond)00.16

Current year’s results

The book value has increased by 44.93 percent, totaling €164.7 thousand. This book value consists of a portfolio of financial assets and a 50 percent ownership share in my flat. I have a debt of €33.0 thousand associated with the purchase of the flat. As previously mentioned, the value of the portfolio is €138.9 thousand, with the remaining amount attributed to the value of the flat.

The table below outlines the composition of book value.

MetricValue (€)
Total Assets 197677.64
Total Liabilities33002.02
Book Value164675.63

Since 2018, the book value has been growing at an average rate of 44.93 percent per year. This growth has mainly been driven by salary increases, interest, dividends, and asset appreciation. However, such a high growth rate is not sustainable. To maintain or enhance this growth rate, we need to rethink our strategy.

Next year the expected salary savings are projected to contribute approximately 10 percent to the book value. Meanwhile, interest, dividends, and asset appreciation may experience a decline due to relatively high valuations. Even if they contribute positively, we do not expect this impact to exceed 10 percent.

This leads us to reconsider the following question: What will be the sources of additional income/profit in the coming years?

This question concerns an ongoing issue clouded by two unusual outlier investments: Meta Platforms and Spotify. While I expect both companies to yield positive returns in the future, I do not anticipate them growing at the same rate. I want to express my gratitude to these companies for being the driving forces behind our portfolio growth. However, it is now my responsibility to identify new growth engines.

The table below outlines the composition of portfoleo.

Number Of Shares/UnitsHolding Period (days) (1)AssetsCost (€)Market Value (€)IRR (%)Abs.Perf. (%) (2)
545164Jeronimo Martins8941.2710055.253.241.66
151425Berkshire Hathaway3061.936544.6122.47113.74
245.8294Alves Ribeiro4572.004868.893.066.20
357720Vanguard FTSE All-World UCITS ETF (Dist)36757.6347388.1814.9227.87
171458iShares Core MSCI World UCITS ETF USD (Acc)1031.581770.7214.4971.65
126744Vidrala (3)9526.9011705.409.9214.90
26937Meta Platforms, Inc. (4)7523.9714653.2558.12101.75
46807Spotify Technology S.A.5050.2219808.9185.24292.13
88287Dino Polska S.A.7215.088023.9514.0511.16
45979Inpost S.A.7885.547478.09(16.60)(3.90)
  91566.12132297.25
  1. Holding period from the date the first share was bought.
  2. Absolute Performance = market value + sell/outbound deliveries + dividends – taxes – fees – initial valuation – buy/inbound deliveries. This calculation for absolute performance is limited to 2018 to the present.
  3. 14 out of 126 Vidrala shares were issued as bonus shares at no cost, but they are accounted for as an expense, negatively impacting performance.
  4. This year, the sale of Meta shares resulted in realized gains of approximately €2,910.48 which is not contemplated in the table.

The strategy’s core consists of increasing the “look-through” earnings. The earnings sources are salary and investments. The annual letter 2021 contains more details about the “look-through” earnings concept.

The tables below present a draft of my “look-through” earnings. These values are approximations, not precise, and are only used to provide a sense of increase or decrease in the earnings.

AssetsNumber of shares 2024EPS 2023
(origin currency)
EPS 2023 (€) (1)(2)Earnings (€)
Spotify Technology S.A.46-$2.73-2.457-113.02
Jeronimo Martins545€1.21.2654
Meta Platforms, Inc.26$14.8713.383347.96
Berkshire Hathaway, Inc.15$10.069.054135.81
Vidrala S.A.126€6.89€6.89868.14
Dino Polska S.A.88PLN 14.333.1526277.43
Vanguard FTSE All-World UCITS ETF (Dist)357€7.317.312609.67
iShares Core MSCI World UCITS ETF USD (Acc)17€5.305.3090.10
Inpost S.A.459PLN 1.30.286131.27
   5001.36
  1. $1 equals to €0.90.
  2. 1 PLN equals to €0.22.
 20242023Delta (%)
Gross Earnings (€)5001.364109.1521.72
Tax (28%) (€)(1400.38)(1150.56)21.72
Net Earnings (€)3600.982958.5921.72
Net salary savings (€)14000140000
“Look-Through” Earnings (€)17600.9816958.593.79

This year, “look-through” earnings grew by 3.79 percent, driven by net earnings of 21.72 percent. However, the growth in earnings has slowed compared to 2023, when the increase was 10.48 percent. The challenge for the next couple of years will be finding ways to significantly increase “look-through” earnings. Potential solutions might include salary increases or identifying new sources of income.

Success or failure will be measured by the ability or inability to significantly increase earnings.

Portfolio outlook

Finally, this section presents a brief outlook on the portfolio’s future. This year’s results keep us on track to reach a portfolio value exceeding 700,000 euros by 2039.

While this goal is achievable, it might be wise to set higher targets. Doing so could increase the likelihood of reaching the initial goal sooner, while also opening up new horizons and opportunities for further achievements.

In the coming years, I am committed to exceeding these goals.             

Annual Letter 2023

This post captures my financial journey throughout the year 2023. It continues the documentation initiated in 2021 through two earlier articles titled Annual Letter 2021 and Annual Letter 2022.

I hope this article adds value to your life. While my financial numbers and goals may not directly apply to you, please adapt the insights to your reality. Consider factors such as your country, financial position, and personality.


1st of January 2024

Dear Future, Me,

The year 2023 proved to be highly favorable for all investors. The S&P 500 index, measured in US dollars, experienced an impressive growth of almost 25 percent. Fortunately, our portfolio mirrored this trend and achieved its peak value of 92.8 thousand Euros. Frankly, the portfolio’s return surpassed my expectations, which is undoubtedly positive.

This letter will cover three main aspects: the asset allocation within the portfolio, the results from the current year, and the outlook for the portfolio moving forward.

Portfolio asset allocation

In 2023, a significant portion of our investment portfolio was directed towards individual stocks and ETFs, driven by appealing opportunities. These opportunities are a result of the dip in asset prices the previous year. Nevertheless, due to the investments made in the current year, our cash position suffered a significant decline. In the upcoming year, prioritizing the increase of liquidity will be essential to strengthen the portfolio survival prospects and to have enough firepower to take eventually future opportunities.

The table below illustrates the portfolio allocation by asset.

Assets2023 (%)2022 (%)
ETFs38.8632.49
Individual Stocks46.3331.43
Equity and bond funds9.9721.30
Cash and equivalents4.6913.40
Personal Bond (NMC Bond)0.161.38

Current year’s results

An unusual year in the stock market returns support a book value growth of 56.11%.  The book value, including real estate equity, reached 116.6 thousand Euros.

The table below presents the portfolio return by asset, excluding real estate. The return of the individual stocks stands out from the others with an impressive 37.31 percent. This performance resulted from some new investments, the outcome of the stock market ‘mini’ crash last year.

Unfortunately, in the long term, the performance of individual stocks will be similar to the ETF Vanguard FTSE All-World. However, these returns boosted the overall portfolio performance to a 26.89% growth in 2023.

Assets2023 (%)Since 2020 (%/per year)
Fund ‘PPR Alves Ribeiro’10.522.43
Vanguard FTSE All-World UCITS ETF (Dist)17.467.80
iShares Core MSCI World UCITS ETF USD (Acc)19.9510.56
Individual stocks37.3118.01
Equity fund ‘Ações Líderes globais’15.188.57

The following table shows more details about some assets of the portfolio. The gap between the cost price and the current market value is around 25.55 percent higher, and the average holding period is 1012 days.  To simplify the calculation of the holding period, the method was changed. The period starts counting when the first share is bought and ends when the last share is sold. 

The gap between cost and market value is expected to grow but not significantly. The main reason for this show growth is that the increase in the company’s earnings will be slow, and we will continue to invest in the next couple of years, increasing the price cost.

Finally, the two outlier investments this year were Meta Platforms S.A and Spotify-Technology S.A, with an absolute return of more than 50%.

Number Of Shares/UnitsHolding Period (days) (1)AssetsCost (€)Market Value (€)
2971880Jeronimo Martins5811.246854.76
151336Berkshire Hathaway3061.934850.81
3421385Alves Ribeiro6104.118870.63
218.61244Ações lideres globais23752936.99
3131098Vanguard FTSE All-World UCITS ETF (Dist)31667.3833647.50
171091iShares Core MSCI World UCITS ETF USD (Acc)1031.581391.79
120746Vidrala8961.1011460
26683Meta Platforms, Inc.4643.788335.43
46564Spotify Technology S.A.5050.227911.77
3793Dino Polska S.A.3085.133894.29
   71791.4790153.97
  1. Holding period since the data that the first share was bought.

The strategy’s core consists of increasing the “look-through” earnings. The earnings sources are salary and investments. This year the contribution from salary stayed flat, but lucky the earnings from investment increased almost 100 percent.

To summarize, the “look-through” earnings increased 10.27 percent from 15.4 to 16.9 thousand Euros, and almost 25 percent of them came from investments.

The tables below present a draft of my “look-through” earnings. The annual letter 2021 contains more details about the “look-through” earnings concept.

AssetsNumber of shares 2023Earnings per share 2022 (€) (1)Earnings (€)
Spotify Technology S.A.46-2.23-102.58
Jeronimo Martins2970.94208.12
Meta Platforms, Inc.268.59223.34
Berkshire Hathaway1520.94314.1
Vidrala1204.73567.6
Ações lideres globais218.60.79172.70
Dino Polska S.A.3711.55427.35
Vanguard FTSE All-World UCITS ETF (Dist)3236.842209.32
iShares Core MSCI World UCITS ETF USD (Acc)174.9589.20
   4109.15
  1. After fees and taxes.
 20232022Delta (%)
Gross Earnings (€)4109.152054.8699.97
Tax (28%) (€)(1150.56)(575.36)99.97
Net Earnings (€)2958.591379.5114.47
Net salary savings (€)14000140000
“Look-Through” Earnings (€)16958.5915379.510.27

Portfolio outlook

Finally, this last section presents a brief expectation about the portfolio’s future. The current year’s result allows us to anticipate portfolio results in two years.  Now, it’s expected that the portfolio reach the value of 700 thousand Euros in 2039 instead of 2041.

In the coming years, I am committed to exceeding these goals.             

Annual Letter 2022

The post Annual Letter 2021 documented my financial journey through the year 2021. In this new post, I did the same exercise for the year 2022. I hope this article adds value to your life.

My financial numbers and goals may not directly apply to you. Please, adapt the insights to your reality, considering factors like your country, financial position, and personality.


1st of January 2023

Dear Future Me,

I hope this letter finds you well! It marks the second year of our annual new tradition—documenting our journey through the stock market. Buckle up; there’s much to share!

Portfolio asset allocation

Let’s start with an image of our current portfolio valued at 53.6 thousand euros. It comprises approximately 13.40% in cash, 21.30% invested in bonds and equity funds (Ações lideres globais and PPR Alves Ribeiro), 32.49% invested in the ETF Vanguard FTSE ALL-World, and approximately 31.43% invested in individual stocks.

Now, 2022 has been a rollercoaster. The drop in stock prices has opened the door to some new opportunities.

A significant part of the available cash was invested in the ETF Vanguard FTSE ALL-World and individual stocks. Check out the table below for a quick summary of the changes:

Asset type2022 (%)2021 (%)
ETF Vanguard FTSE ALL-World32.4923.08
Individual stock31.4323.55
Equity and bond funds21.3023.35
Cash and equivalents13.4030.02
Personal Bond (NMC Bond)1.38

In short, our holdings in the ETF and individual stocks have increased significantly. Cash has decreased, and we have welcomed a new security – NMC Bond.

NMC Bond is not an investment; it’s a loan to pay for next year’s wedding party. The loan cost will be 0% interest plus the opportunity cost. The long-term goal is to repay the loan, but in the medium term, the loan will represent at least 1.5% of the portfolio value. By the end of 2023, it will be at least 8% (€4000).

The table below summarizes the expected wedding party costs.

Expected costs (€)7500–9000
Expected revenue (€)4000
Expected profit/loss (€)(-3500)-(-4000)

Long-term portfolio structure

Now, this section presents the long-term portfolio structure goal. The structure is designed for a secure, stable, and reliable income source with minimal effort. About 50% goes to the ETF, 35% to individual stocks, and the rest dabbles in cash and other investments.

AssetsPercentage minimum and maximum (%)
ETF Vanguard FTSE ALL-World50 -85
Individual Stock0-35
Others0-10
Cash0-5

For next year, the minimum amount saved will be fourteen thousand euros (14k). 10% will remain in cash, 14% will be invested in a tax-advantaged fund (PPR Alves Ribeiro), and the remainder will be invested in the ETF. Investing in individual stocks is optional but can also happen.

Current year’s results

The book value (stock portfolio + real estate) increased by 19.48%, reaching €74,718.88. It’s a little shy compared to 2021’s 49% growth. The decrease in growth is due to the fall in share prices and the size of assets under management. The main contribution to the growth in book value was savings, and a debt reduction (real estate loan).

The table below gives you a peek into the performance, the calculation of values ​​may contain gross errors:

Assets 2022 (%)Since 2020 (%/per year)
Fund ‘PPR Alves Ribeiro’-11.103.47
ETF FTSE ALL-World-13.617.82
Individual Stocks-2.0511.57
Equity fund ‘Ações Líderes globais’-14.639.7

In the future, the fund ‘Ações Lideres Globais’ will not receive more capital contributions. To simplify the investment process and to reduce the fees paid the capital will be deployed in ETF FTSE ALL-World.

Now, let’s crunch some portfolio numbers. The average security holding period is 547 days, more 122 days than last year, the current price is ~1.9% lower than the purchase price, and the portfolio age is three years old, excluding Jeronimo Martins‘s investment. The gap between purchase and current prices will improve if the companies can generate profits and reinvest part of it successfully.

The table below summarizes portfolio numbers.

Number Of Shares/UnitsHolding Period (days)CompanyCost (€)Market Value (€)
921515Jeronimo Martins997.71856.56
15693Berkshire Hathaway3061.934344.18
533.6668PPR Alves Ribeiro89858870.63
218.6600Ações lideres globais23752548.34
188518FTSE ALL-World ETF19090.3417416.32
80274Vidrala5638.606432.00
5205Meta Platforms, Inc.2339.391353.91
12292Meta Platforms, Inc.913.55564.13
31161Spotify Technology S.A.3178.272294.63
   46579.7845680.7

The core of the strategy is to increase the “look-through” earnings.

The “look-through” earnings represent the income that I can generate and save each year. Currently, most of its earnings come from my salary (~91%). The remaining income is generated from the companies that I invested in.

The following table shows a draft of my “look-through” earnings.

AssetsNumber of shares in 2022Earnings per share 2021 (€) (1)Total 2021 (€)Total 2020(€)Variations (%)
Spotify Technology S.A.31-0.18-5.58
Jeronimo Martins920.7468.08
Meta Platforms, Inc.1713.8234.6
Berkshire Hathaway155.5483.1
Vidrala804.65372
Ações lideres globais218.60.67146.462
FTSE ALL-World ETF1886.151156.2
   2054.861055.8894.61
Tax (28%)  (575.36)(295)95.00
Net EPS  1379.5760.8881.30
Net salary savings  14000131606.38
“Look-Through” Earnings  15379.513920.8810.48
  1. After fees and taxes.

This year, they increased by 10.48%, thanks to salary increases (6% increase) and soaring net earnings per share (81% increase).

Portfolio outlook

Let’s look at the portfolio’s outlook. Even with a slight deviation from the plan, it is expected to reach the value of 738 thousand euros in 2041. In the coming years, I am committed to exceeding these goals.

Annual Letter 2021

Since 2021, I’ve been documenting my financial journey through annual letters. Each year, I review my accomplishments and plans. Writing to myself enables reflection and the documentation of my financial journey.

Please note that my financial numbers and goals may not directly apply to you. You’ll need to adapt the insights to your reality, considering factors like your country, financial position, and personality.

I encourage you to embark on your financial reflection journey. It’s a rewarding practice that can offer valuable insights into your financial decisions. Whether you find practical takeaways or simply enjoy a moment of relaxation, I hope this article adds value to your life.


1st of January 2022

Dear Future Me,

This letter inaugurates an annual series documenting my journey through the stock market. Each entry encapsulates my thoughts, expectations, strategies, and results. The four integral sections cover portfolio asset allocation, the expected return of the portfolio, the results for 2021, and the portfolio outlook.

Portfolio Asset Allocation

As of December 31, 2021, my portfolio comprises approximately 30% cash and term deposits, 23% in bonds and equity funds, 23% in a Global ETF (FTSE ALL-World), and another 23% in stocks selected for me.

Cash and Term Deposits: The portfolio maintains a high level of cash and equivalents, not as an attempt to predict a market crash but to ensure sufficient liquidity to face any unforeseen challenges. Over time, the cash percentage will decrease but always remain at least equal to one year of my expenses.

Bonds and Equity Funds: A significant portion (80%) of the capital invested in global equity and bond funds is allocated to a fund named ‘PPR Alves Ribeiro.’ This investment aims to secure tax benefits, resulting in an annual reduction equal to 20% of the allocated capital, up to a maximum of €400. While some argue that this money might have compounded at a higher rate in a global equity index, the certainty of this tax break is a key consideration. It is anticipated that the weight of this investment in the portfolio will diminish as the portfolio value increases and the tax reduction decreases with age. The remaining capital is invested in an equity fund named ‘Ações Líderes Globais,’ primarily focused on the quality factor and expected to perform at the level of a global equity index.

Global ETF (FTSE ALL-World): A significant portion of the portfolio is allocated to the FTSE ALL-World ETF, representing almost 95% of public companies worldwide. This fund’s performance reflects the anticipated average return of the global stock market, with expectations for most of the portfolio’s capital to be invested here in the long term.

Equity Investments: Finally, there are a couple of individually selected securities that outperform the expected average return of the global stock market, benchmarked against the FTSE ALL-World index. My approach is to acquire a business, preferably a great one, at prices that allow a net compounding rate exceeding at least 3% of the expected average net return of the global stock market for no less than ten years.

The Expected Return of the Portfolio

The portfolio’s expected return is 5.77% pa (gross value) and 4.05% pa (net value). The estimation approach varies by asset group. For global equity ETFs and equity funds, the expected return is based on the historical performance of the fund’s benchmarks. As no benchmark was found for ‘PPR Alves Ribeiro,’ belonging to the bond and equity fund group, the average returns over the last five years were utilized. The expected return for individually selected stocks was calculated at the time of purchase, bearing in mind its susceptibility to analysis errors. I intend to enhance net expected returns by reducing the percentage of cash in the portfolio and minimizing failures in stock selection.

AssetsAsset GroupGross return (E) %Net return (E) %Notes
Fund ‘PPR Alves Ribeiro’Bond/Equity funds5.675.22Average of the last 5 years’ performance
FTSE ALL-World ETFGlobal equity ETFs6.574.73Average MSCI ACWI Index performance (since 1972)
Equity fund ‘Ações Líderes Globais’Equity funds6.574.73Average MSCI ACWI Index performance (since 1972)
StocksStock pick10Portfolio stocks expected return analysis

Results

In 2021, my book value increased by approximately 49% from €41,826.97 to €62,584.36. The main drivers for this growth were the increase in my salary, allowing for an improvement in my savings ratio, a reduction in indebtedness (home loan), and the appreciation of the portfolio. This section focuses on portfolio appreciation. The portfolio appreciation, including cash and equivalents, was 12.74%. This unexpected appreciation was driven by the growth of the stock market.

AssetsPerformance (%)
Fund ‘PPR Alves Ribeiro’6.22
ETF FTSE ALL-World27.00
Equity Investments (Stock Picking)29.85
Equity fund ‘Ações Líderes Globais’30.69

The following table contains the purchase prices and current prices of the current portfolio holdings (stocks and funds). The assets’ current prices are approximately 20% higher than the initial prices. However, this variation is not very relevant due to the recent establishment of the portfolio. The average portfolio asset holding period is 425 days, to achieve an average holding period of at least 10 years. I anticipate that the gap between purchase and current prices will increase in the long run, contingent upon companies continuing to generate profits and successfully reinvesting in the business.

Number Of Shares/UnitsHolding Period (days)CompanyCost (€)Market Value (€)
921151Jeronimo Martins997.71849.20
11558Berkshire Hathaway1884.942903.94
377.9447Alves Ribeiro68407790.97
235449The Navigator Company505.2787.25
50436Logista713876.50
141381Ações Líderes Globais15982175.64
72209FTSE ALL-World ETF8813.969849.60
20173Prosus1552.71470.60
2517Vidrala20172165
   24922.529868.7

The subsequent table displays a draft of my “look-through” earnings, the core concept of my strategy. To diversify my income sources, I will utilize all excess capital from my salary to buy stakes in public companies, directly or through funds. The “look-through” earnings represent the income I can generate and save each year, with the majority currently coming from my net salary (approximately 90%). The remaining income is generated from the companies I have stakes in, with the unique aspect of being deployed by the companies’ managers or returned to me through dividends or buybacks. To estimate net “look-through” earnings, the companies’ earnings per share are aggregated, and a tax is applied as if they were distributed as dividends. The primary long-term goal of “look-through” earnings is to increase them and reduce the weight of the salary, despite the expected increase in salary in the future.

InvesteesNumber of shares in 2021Earnings per share 2020 (€) (1)
Logista5066 (2)
Jeronimo Martins9246
The Navigator Company23535.25
Berkshire Hathaway1111.88
Prosus2076 (2)
Vidrala25133.75
Ações Líderes Globais159116
FTSE ALL-World ETF90571
 1055.88 
Tax (28%)(295) 
Net EPS760.88 
Net salary savings13160 
“Look-Through” Earnings13920.88 
  1. After fees and taxes.
  2. Earnings per share of 2021.

Outlook

In this final section, a brief expectation about the future of the portfolio is presented. As mentioned earlier, the portfolio has reached a value of approximately €42,000. Assuming the materialization of the expected return presented before for the portfolio value, it will reach the value of €705,000 in 2041.

In the upcoming years, I am committed to surpassing these goals.